Year 2016 Lake Mead Update (June 30, 2016):
HEADLINE: Lake Mead Level Drops to Historic Low.
Lake Mead elevation as of June 30, 2016 was 1071.64 feet, which is 157.36 feet below capacity.
This is the lowest elevation since the lake was originally filled in the mid 1930's.
This elevation is over ten feet lower than observed in our last Lake Mead Report in 2014
As of July 15, 2016 (when this report was created), the elevation of Lake Mead was 1071.96 feet, which is only 0.36 feet higher and within the typical day to day variation of elevation of Lake Mead. That is, the elevation was not rising or falling two weeks following the record low elevation of June 30, 2016. Increased releases from Lake Powell in the Fall of 2016 could push the elevation higher, but only slightly higher.
Table of Historical Lake Mead Levels through June 2016:
..NOTE: Monthly elevation data shows the elevation on the last day of each month.
Current Daily Lake Mead Elevations.
Lake Mead Information:
Lake Mead is the largest reservoir in the U.S. It is located on the Colorado River about 25 miles from downtown Las Vegas and located at the Nevada/Arizona border. It is formed by the Hoover Dam, and when full, Lake Mead is 112 miles long, has a maximum depth of around 500 feet and it also has 550 miles of shoreline.
Lake Mead has not reached capacity for more than 15 years and has been lowered due to multiple factors. A prolonged drought in the Southwestern U.S. with reduced snowfalls and decreased runoff in Colorado (i.e. the headwaters of the Colorado River that feed into Lake Mead) has been the primary cause of this prolonged decrease in elevation. It should also be noted that there is also increased human demand for water in the Las Vegas Valley as the population continues to grow in this region. (note the population tables below). Las Vegas has responded however, by undertaking many successful measures to reduce local water usage.
Lake Mead Elevations:
Lake Mead Maximum Elevation (Capacity): 1229.0 feet
Lake Mead Elevation, June 30, 2016: 1071.64 feet (157.36 feet below capacity)
Lake Mead elevation, most recent peak, October 1998: 1215.76 feet (13.24 feet below capacity)
Lake Mead elevation, record minimum, June 30, 2016, 1071.64 feet (146.64 feet below capacity)
Lake Mead Facts: (Information source, Bureau of Reclamation, Lower Colorado Region, Boulder City, NV)
What is the lake's elevation at high-water?
The high-water line is at 1,229 feet above sea level. At this elevation, the water would be more than 7 1/2 feet over the top of the raised spillway gates, which are at elevation 1,221.4 feet. All lands below elevation 1,250 have been retained for reservoir operations purposes.
What is the reservoir's area?
At elevation 1,221.4 feet the reservoir covers about 158,500 acres or 248 square miles.
How long and wide is the reservoir?
At elevation 1,221.4 feet, Lake Mead extends approximately 110 miles upstream toward the Grand Canyon. It also extends about 35 miles up the Virgin River. The width varies from several hundred feet in the canyons to a maximum of eight miles.
How much water will Lake Mead hold?
Approximately 28,945,000 acre-feet. An acre-foot is the amount of water required to cover one acre to a depth of one foot, or approximately 326,000 gallons. The reservoir will store the entire average flow of the Colorado River for two years. That is enough water to cover the State of Pennsylvania to a depth of one foot.
How is the reservoir capacity allotted?
Below elevation 1,229, about 1,500,000 acre-feet of storage capacity is reserved exclusively for flood control; about 2,547,000 acre-feet for sedimentation control; about 18,438,000 acre-feet for joint use (flood control, municipal and industrial water supply, irrigation and power); and 7,683,000 acre-feet for inactive storage.
Who operates the dam and reservoir?
The Bureau of Reclamation operates and maintains the dam, power plant and reservoir. The National Park Service administers recreational activities in and around Lake Mead as part of Lake Mead National Recreation Area.
What is the estimated annual evaporation of the reservoir?
About 800,000 acre-feet each year.
Where does the water from Lake Mead go for household use?
|
Irrigation: 47%
|
Water Waste: 23%
|
Toilet: 8%
|
Laundry: 6%
|
|
Other Indoor Use: 6%
|
Faucet: 5%
|
Shower: 5%
|
|
Source, City of Henderson, Las Vegas and North Las Vegas.
Graphing the Changes in Elevation of Lake Mead:
The following graph shows the elevation of Lake Mead for each June, 1935 through 2016.
The month of June was chosen to correspond to my most recent visit to Lake Mead on June 30, 2016.
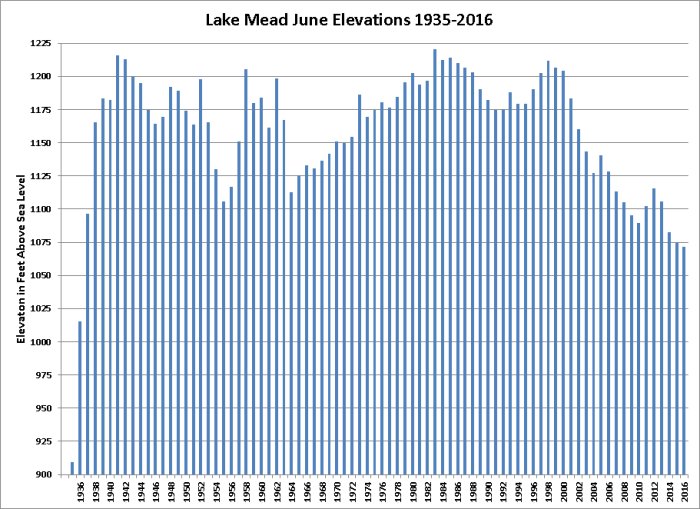
> The level of Lake Mead at Hoover Dam started falling in November 1998, just after it reached the
all-time high of 1215.76 feet.
> Lake Mead reached its lowest point at 1071.64 feet on June 30, 2016, 144.12 feet below the recent peak of 1998.
> Lake Mead was dedicated in 1935 and began filling up that year. Note that the elevation in July 1935 and 1936 (see our table: Table of historical Lake Mead Levels.) was only 928.40 feet and 1020.40 feet. Because Lake Mead was in the process of filling up in 1935-36, the actual record minimum elevation following the initial fill up of the Lake occurred on June 30, 2016. The level of the lake could continue to fall below the June 30, 2016 elevation by next Summer, however that depends upon the amount of snowfall in Colorado this coming Winter and subsequent melt and runoff next Spring 2017.
> It took 19 years after the 1964 low point for Lake Mead to fill up again.
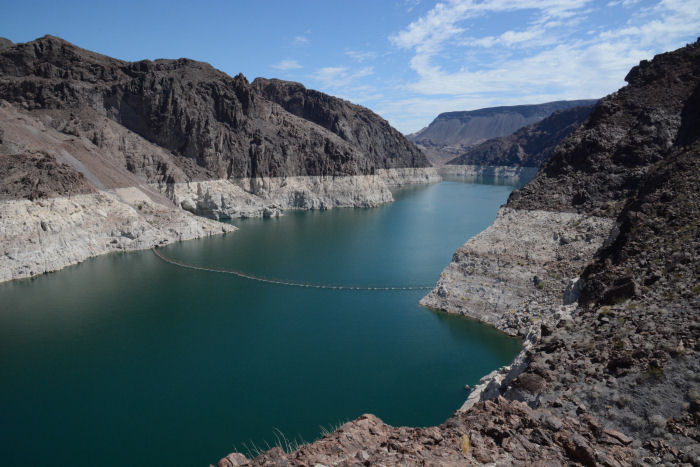
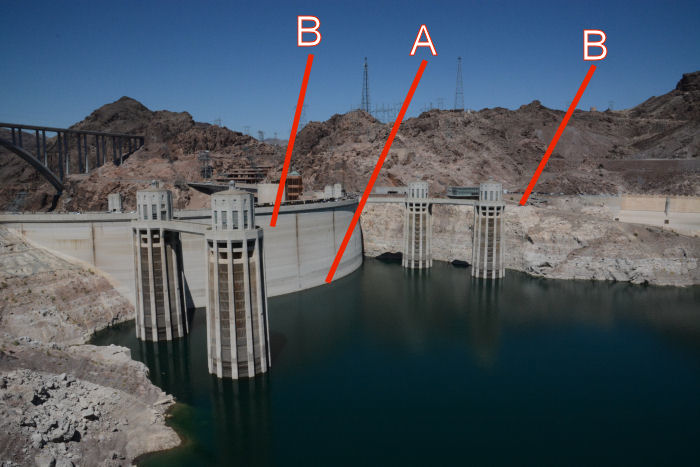
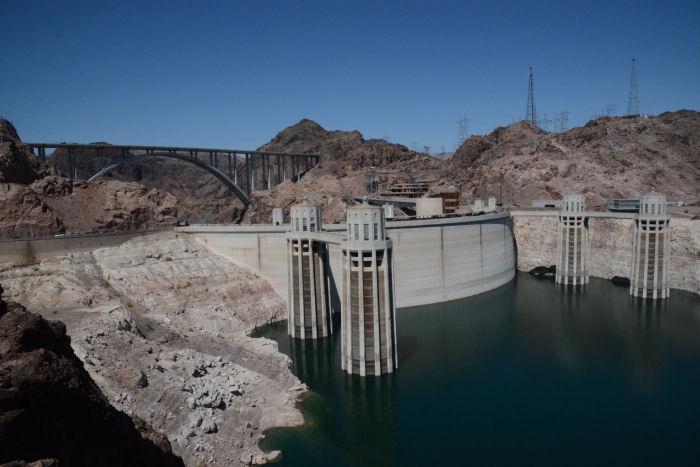
Lake Mead, June 30, 2016. Note the bathtub ring with the water level down 157 feet from capacity.
Photo ©
Ken Dewey, Applied Climate Science, SNR, UNL.
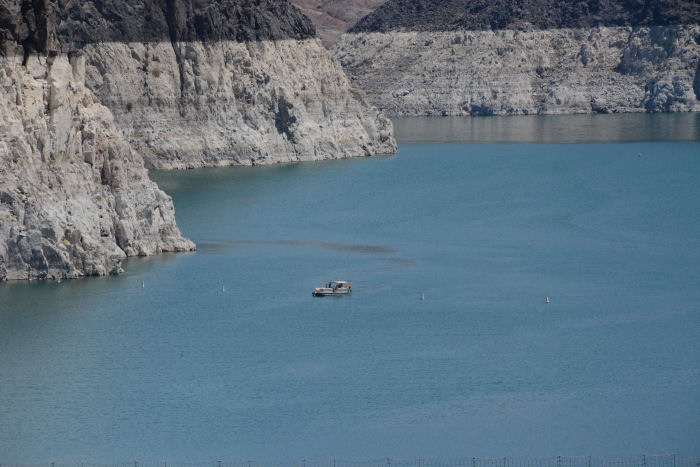
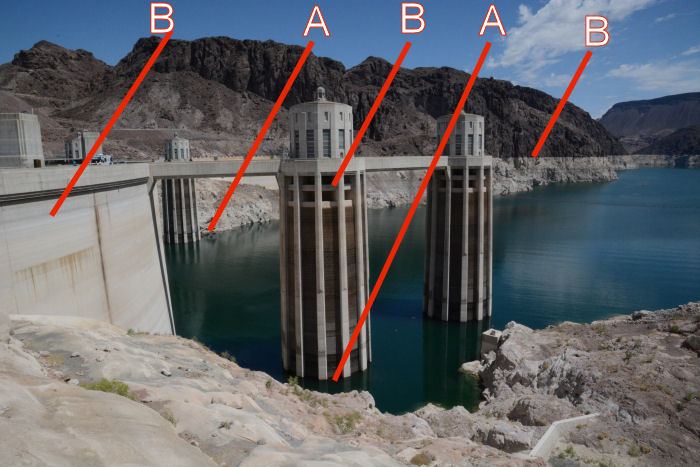
June 30, 2016 Lake Mead. Note the boat for scale compared to the top of the "bathtub ring".
Photo ©
Ken Dewey, Applied Climate Science, SNR, UNL.
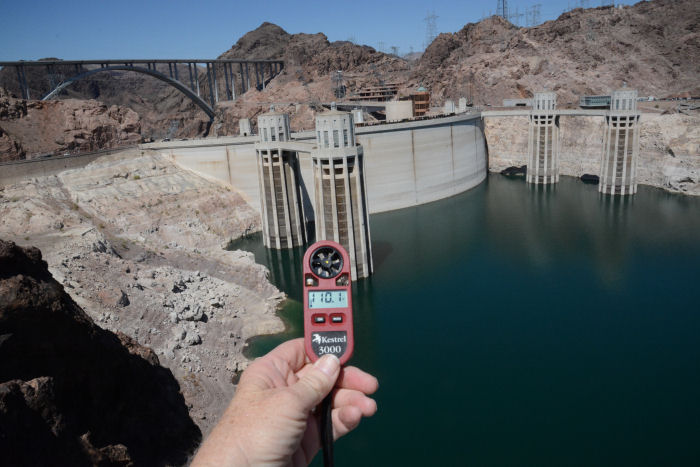
June 30, 2016 Lake Mead. Mid day temperature of 110.1F. Photo ©
Ken Dewey, Applied Climate Science, SNR, UNL.
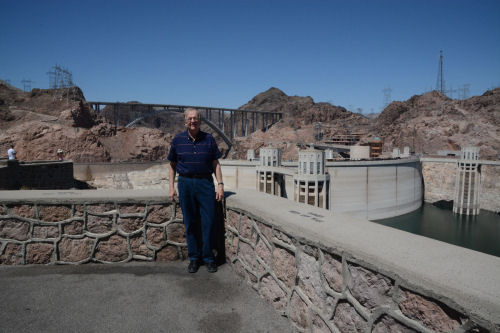
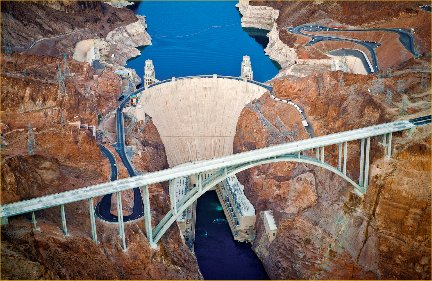
June 30, 2016 Lake Mead. Looking south across Hoover Dam and at the bypass bridge.
Photo ©
Ken Dewey, Applied Climate Science, SNR, UNL.
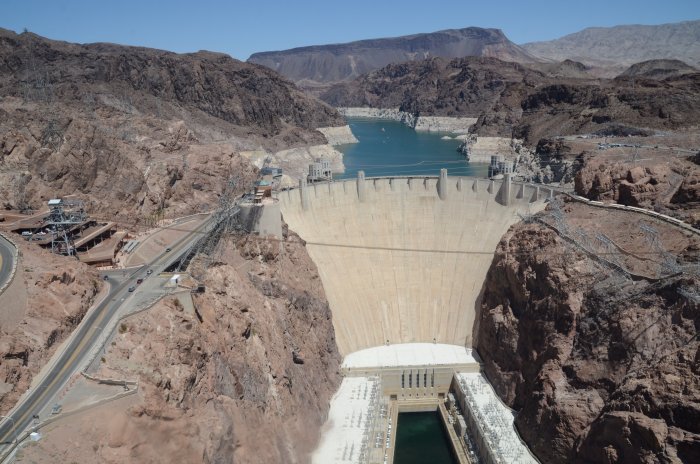
June 30, 2016 Lake Mead. Looking south from the top of Hoover Dam and at the bypass bridge.
Photo ©
Ken Dewey, Applied Climate Science, SNR, UNL.
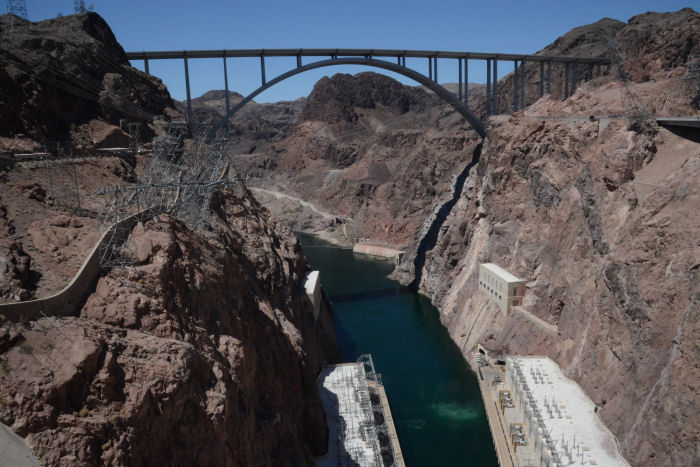
June 30, 2016 Looking at Hoover Dam and Lake Mead from the pedestrian walkway on the bypass bridge.
Photo ©
Ken Dewey, Applied Climate Science, SNR, UNL.
LINK: YouTube video about the Bypass Bridge.
Click on this HDRIC image or here >> LINK to see information about the bridge
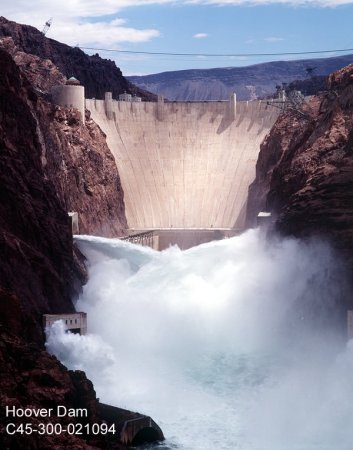
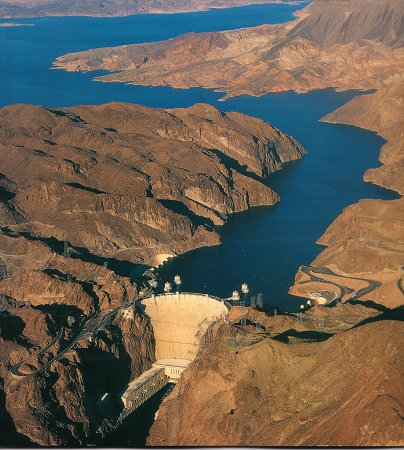
Photos of Lake Mead when it is at capacity
|
|
Lake Mead when full.
Photo courtesy of the Bureau of Reclamation
|
Lake Mead when full.
Photo courtesy of the Bureau of Reclamation
|
|
|
|
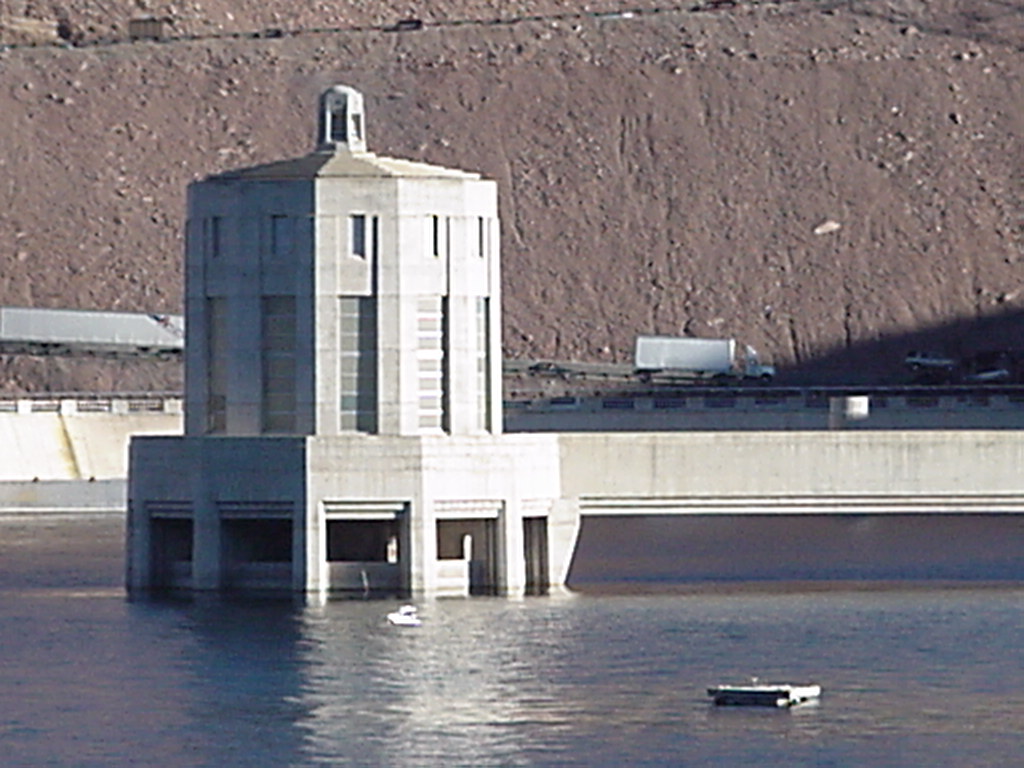
April 1998: Elevation 1212.74 feet
|
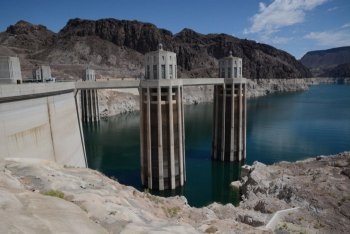
June 30, 2016: Elevation 1071.64 feet
Photo ©
Ken Dewey, Applied Climate Science, SNR, UNL.
|
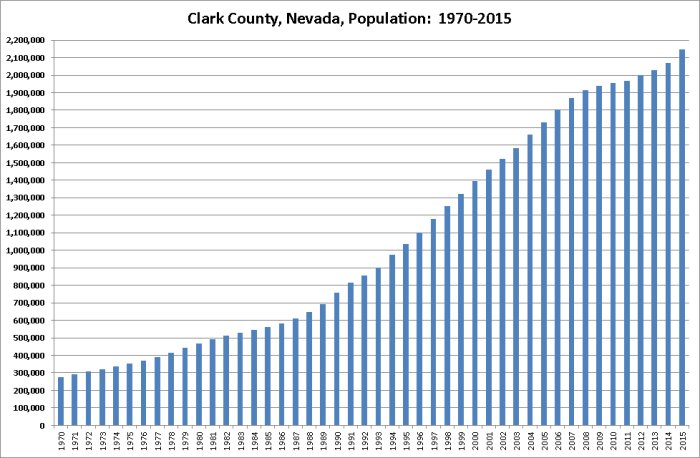
The Phenomenal Growth of Las Vegas, NV and Clark County, NV:
The recent rapid increase in both residents and tourists coming to Las Vegas and Clark County has placed a huge demand on water resources. However this pace has dramatically slowed from 2007 to 2011 due to the large scale U.S. economic slowdown. For the first time in the history of the region, the population actually decreased from 2007 to 2008 and 2010 to 2011 in Clark County (with the decrease in population from 2010 to 2011 being the largest).
Clark County, NV: Population
2007: 1,996,542
2008: 1,986,146
A decrease of 10,396 residents
Clark County, NV: Population
2010: 2,036,358
2011: 1,966,630
A decrease of 69,728 residents
The population has begun to rapidly increase again.
Clark County, NV: Population
2013: 2,029,316
2014: 2,069,681
2015: 2,147,641
A 2 year increase of 118,325 residents from 2013 to 2015
When it all began.............
1905 -- Town of Las Vegas established by auctioning of land.
1911 -- The city of Las Vegas is incorporated.
1931 -- Hoover Dam construction begins in Black Canyon.
Las Vegas, NV, and Clark County, NV Population 1910-2015
Year |
Las Vegas |
Decade Increase |
Clark County |
Decade Increase |
1910 |
25 |
. |
N/A |
. |
1910 |
945 |
920 |
N/A |
. |
1920 |
2,304 |
1,359 |
4,859 |
. |
1930 |
5,165 |
2,861 |
8,422 |
3,563 |
1940 |
8,422 |
3,257 |
16,414 |
7,992 |
1950 |
24,624 |
16,202 |
48,289 |
31,875 |
1960 |
64,405 |
39,781 |
127,016 |
78,727 |
1970 |
125,787 |
61,382 |
273,288 |
146,272 |
1980 |
164,674 |
38,887 |
463,087 |
189,799 |
1990 |
286,600 |
121,926 |
741,459 |
278,372 |
1995 |
374,239 |
. |
1,040,688 |
. |
2000 |
484,500 |
198,500 |
1,428,690 |
687,231 |
2005 |
544,806 |
. |
1,815,700 |
. |
2010 |
583,756 |
99,256 |
2,036,358 |
607,688 |
2015 |
628,711 |
. |
2,114,801 |
. |
LINK: Satellite Images Showing the Growth of Las Vegas
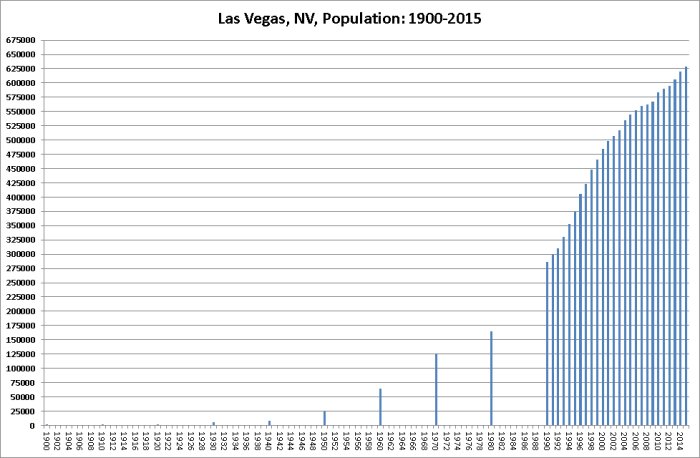
Las Vegas Population: I only have yearly data for 1990 to 2015.
Prior to 1990 I only have population data for the start of each numbered decade.
The population totals for 1900 (25); 1910 (945); 1920 (2,304) are so small that they do not show up on the above graph.
The population total for 1930 (5,165) barely shows on the graph
Watch an animated map showing Las Vegas spread out into the desert since the 1970's
 -- --
Number of Visitors to Las Vegas (1970-2015):
Number of visitors to Las Vegas in 2015: 42.312,216
Number of visitors to Las Vegas in 2014: 41,126,512
Number of visitors to Las Vegas in 2013: 39,668,221
Number of visitors to Las Vegas in 2012: 39,727,022
Number of visitors to Las Vegas in 2011: 38,928,708
Number of visitors to Las Vegas in 2010: 37,335,436
Number of visitors to Las Vegas in 2000: 35,849,691
Number of visitors to Las Vegas in 1990: 20,954,420
Number of visitors to Las Vegas in 1980: 11,941,524
Number of visitors to Las Vegas in 1970: 7,361,783
|