Year 2012 (December 2012) Lake Mead Drought Update.


Lake Mead at Hoover Dam, December 21, 2012. Photo © Ken Dewey, Applied Climate Science, SNR, UNL.
The red lines labeled "A" and "B" show the "bathtub ring", i.e., the height of the water when the Lake is at capacity.
The red line with the label "C" shows the height of the water level on December 21, 2012.
The elevation of "A" and "B" is 1229 feet.
The elevation of "C" is 1120 feet or 109 feet below capacity
. The white "bathtub ring" is the result of exposing rocks that were at one time under the water and collecting mineral deposits.  A clear glass, for example, dipped in water and then allowed to dry will have mineral deposit "spots" on the glass.

LINK: December 2012 Lake Mead Photo Gallery

I have been monitoring the drought in the Southwestern U.S. for a decade with an emphasis on the drought impacts in The Las Vegas area and Lake Mead.

Note the following links for the previous reports that I have created for the High Plains Regional Climate Center, The National Drought Mitigation Center and the Applied Climate Science Group here in the School of Natural Resources at UNL.
Year 2009 Drought in the Southwestern U.S.
Year 2007 Drought in the Southwestern U.S.
Year 2006 Drought in the Southwestern U.S.
Year 2003 Drought in the Southwestern U.S.
Year 2002 Drought in the Southwestern U.S.

Year 2012 Lake Mead Update (December 2012):

Lake Mead is the largest reservoir in the U.S. It is located on the Colorado River about 25 miles from downtown Las Vegas and located at the Nevada/Arizona border. It is formed by the Hoover Dam, and when full, Lake Mead is 112 miles long, has a maximum depth of around 500 feet and it also has 550 miles of shoreline. Lake Mead has not reached capacity for more than a decade and has been lowered due to two factors: (1) increased human demand for water in the Las Vegas Valley and (2) by a prolonged drought in the Southwestern U.S.

Lake Mead Elevations:

Lake Mead Maximum Elevation (Capacity): 1229.0 feet
Lake Mead Elevation, December 2012: 1120.36 feet (108.64 feet below capacity, 95.40 feet below the 1998 peak elevation)
Lake Mead elevation, most recent peak, October 1998: 1215.76 feet (13.24 feet below capacity)

Lake Mead elevation, record minimum, November 2010, 1081.94 feet (146.64 feet below capacity)
Historical Lake Mead Elevations are listed below in a table for the time period 1935-2012.

Lake Mead Facts: (Information source, Bureau of Reclamation, Lower Colorado Region, Boulder City, NV)

What is the lake's elevation at high-water?
The high-water line is at 1,229 feet above sea level. At this elevation, the water would be more than 7 1/2 feet over the top of the raised spillway gates, which are at elevation 1,221.4 feet. All lands below elevation 1,250 have been retained for reservoir operations purposes.

What is the reservoir's area?
At elevation 1,221.4 feet the reservoir covers about 158,500 acres or 248 square miles.

How long and wide is the reservoir?
At elevation 1,221.4, Lake Mead extends approximately 110 miles upstream toward the Grand Canyon. It also extends about 35 miles up the Virgin River. The width varies from several hundred feet in the canyons to a maximum of eight miles.

How much water will Lake Mead hold?
Approximately 28,945,000 acre-feet. An acre-foot is the amount of water required to cover one acre to a depth of one foot, or approximately 326,000 gallons. The reservoir will store the entire average flow of the Colorado River for two years. That is enough water to cover the State of Pennsylvania to a depth of one foot.

How is the reservoir capacity allotted?
Below elevation 1,229, about 1,500,000 acre-feet of storage capacity is reserved exclusively for flood control; about 2,547,000 acre-feet for sedimentation control; about 18,438,000 acre-feet for joint use (flood control, municipal and industrial water supply, irrigation and power); and 7,683,000 acre-feet for inactive storage.

Who operates the dam and reservoir?
The Bureau of Reclamation operates and maintains the dam, power plant and reservoir. The National Park Service administers recreational activities in and around Lake Mead as part of Lake Mead National Recreation Area.

What is the estimated annual evaporation of the reservoir?
About 800,000 acre-feet each year.

Where does the water from Lake Mead go for household use?

Irrigation: 47%
Water Waste: 23%
Toilet: 8%
Laundry: 6%
Other Indoor Use: 6%
Faucet: 5%
Shower: 5%
Source, City of Henderson, Las Vegas and North Las Vegas.


Graphing the Changes in Elevation of Lake Mead:

The following graph shows the elevation of Lake Mead for each December 1935 through 2012.
The month of December was chosen to correspond to my most recent visit to Lake Mead in December 2012
.

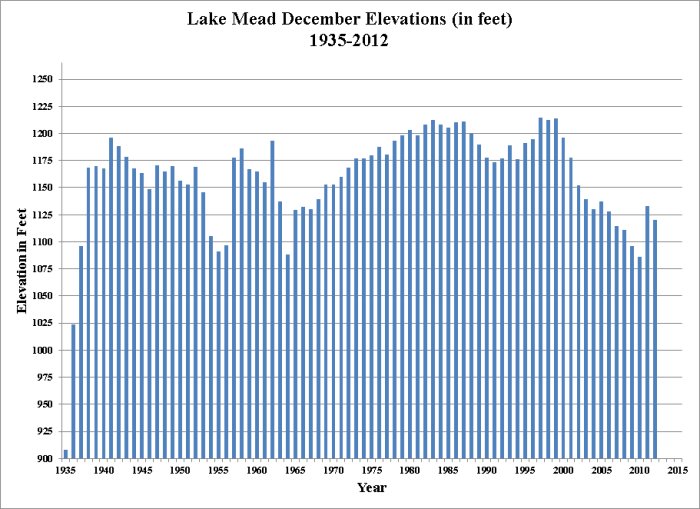
> The level of Lake Mead at Hoover Dam started falling in November 1998, just after it reached the
    all-time high of 1215.76 feet.

> Lake Mead reached its lowest point at 1082.36 feet in October 2010, 133.4 feet below the peak of 1998.

> Lake Mead was dedicated in 1935 and began filling up that year. Note that the elevation in December 1935 and 1936 (see table) was only 908.40 feet and 1023.50 feet. Because Lake Mead was in the process of filling up in 1935-36, the actual record minimum elevation following the initial fill up up of the Lake occurred in 2010.

> The level of Lake Mead at Hoover Dam has risen 38.42 feet since the 2012 minimum.

> It took 19 years after the 1964 low point for Lake Mead to fill up again.

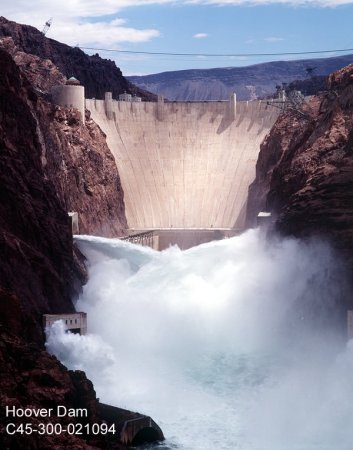
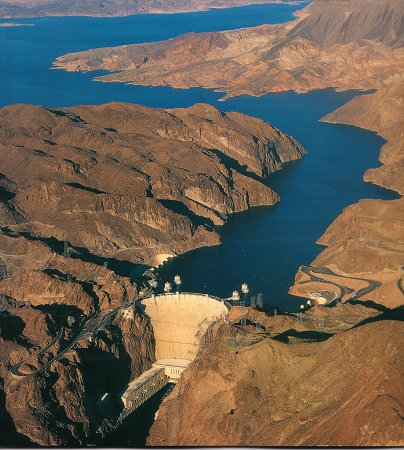
Photos of Lake Mead Full and Lake Mead at Current December 2012 Elevation

Lake Mead when full.
Photo courtesy of the Bureau of Reclamation
Lake Mead when full.
Photo courtesy of the Bureau of Reclamation
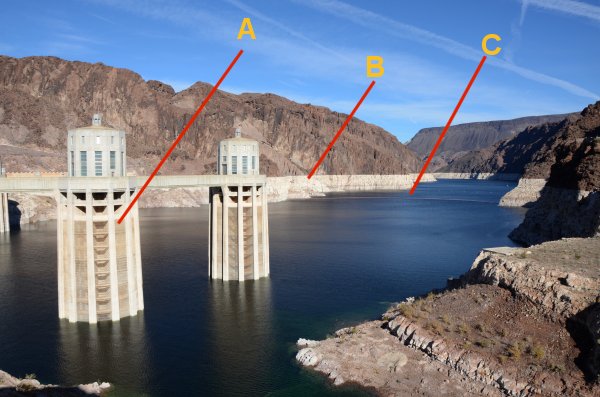
Looking back toward Lake Mead from near the spillway on the east side of the dam. Image © K. Dewey, SNR, UNL 
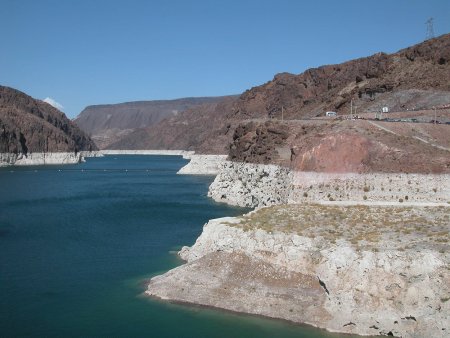
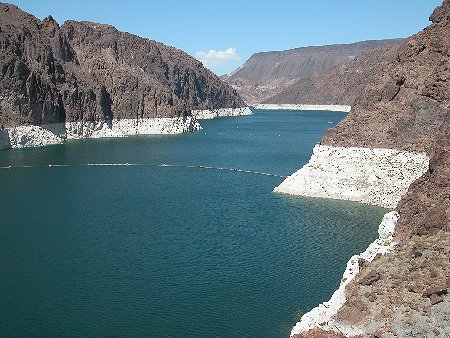
Lake Mead in December 2012 is down 95.4 feet from the 1998 peak elevation. The white rock is the "bathtub" ring for Lake Mead. The exposed rock is white due to salt deposits while submerged.
Image © K. Dewey, SNR, UNL
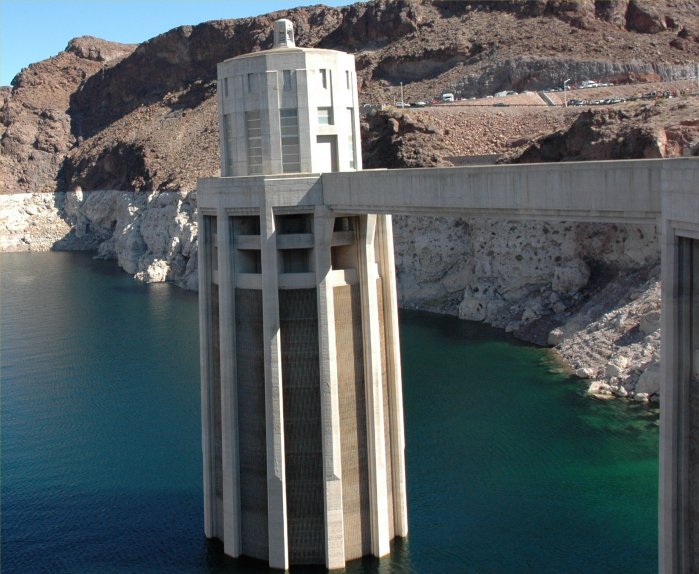
April 1998:  Elevation 1212.74 feet
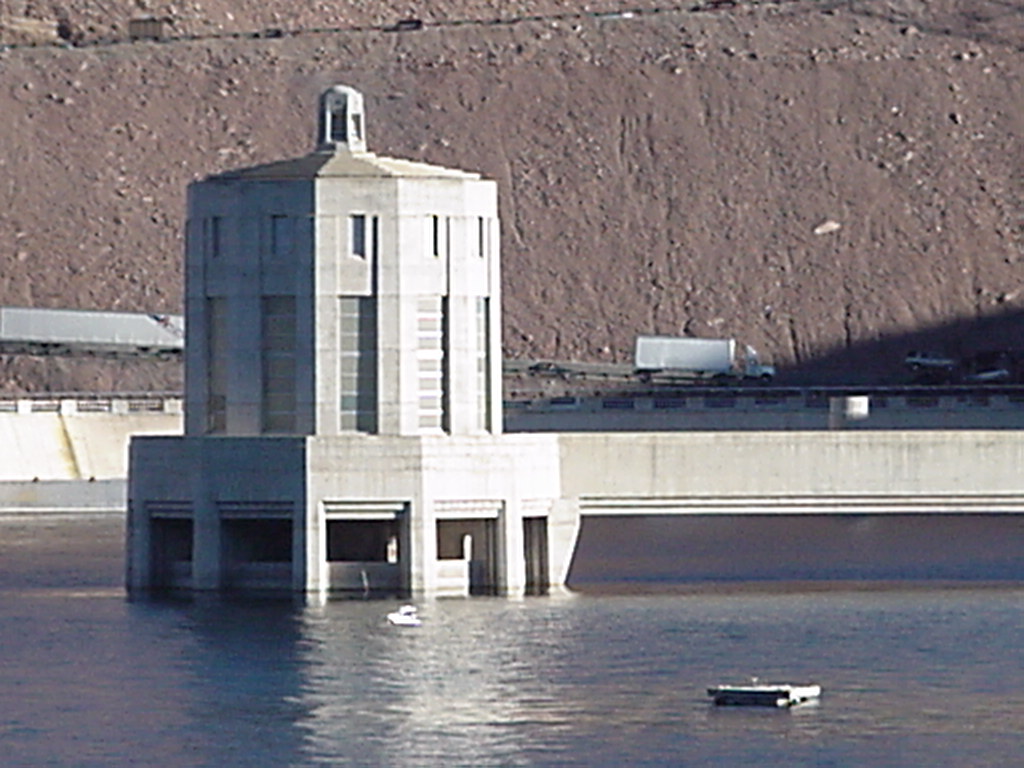
December 2012:  Elevation 1120.36 feet
Photo: Ken Dewey, SNR

The Phenomenal Growth of Las Vegas:

The recent rapid increase in both residents and tourists coming to Las Vegas placed a huge demand on water resources.
However this pace has dramatically slowed the past few years due to the large scale U.S. economic slowdown.

1905 -- Town of Las Vegas established by auctioning of land. 
1911 -- The city of Las Vegas is incorporated.
1931 -- Hoover Dam construction begins in Black Canyon.

Clark County and Las Vegas Population 1910-2011

Clark County............................................................................ Las Vegas

   
Decade
Decade
Annual
Annual    
Decade
Decade
Annual
Annual  
 
Clark Co
Population
%
Population
%
  Las Vegas Population
%
Population
%
 
Year
Population
Increase
Increase Increase Increase   Population
Increase
Increase Increase Increase
Year
1910
N/A
         
945
       
1910
1920
4,859
         
2,304
1,359
143.81%
   
1920
1930
8,422
3,563
73.33%
     
5,165
2,861
124.18%
   
1930
1940
16,414
7,992
94.89%
 
 
8,422
3,257
63.06%
   
1940
1950
48,289
31,875
194.19%  
 
24,624
16,202
192.38%
   
1950
1960
127,016
78,727
163.03%  
 
64,405
39,781
161.55%
   
1960
1970
273,288
146,272
115.16%  
 
125,787
61,382
95.31%
   
1970
1980
463,087
189,799
69.45%
     
164,674
38,887
30.91%
   
1980
1990
741,459
278,372
60.11%
     
286,600
121,926
74.04%
 
1990
1991
829,839
   
88,380
11.92%
 
298,321
   
11,721
4.09%
1991
1992
870,692
   
40,853
4.92%
 
310,197
   
11,876
3.98%
1992
1993
919,388
   
48,696
5.59%
 
330,472
   
20,275
6.54%
1993
1994
986,152
   
66,764
7.26%
 
352,305
   
21,833
6.61%
1994
1995
1,040,688
   
54,536
5.53%
 
374,239
   
21,934
6.23%
1995
1996
1,119,708
   
79,020
7.59%
 
405,517
   
31,278
8.36%
1996
1997
1,170,113
   
50,405
4.50%
 
422,884
   
17,367
4.28%
1997
1998
1,246,193
   
76,080
6.50%
 
448,244
   
25,360
6.00%
1998
1999
1,321,319
   
75,126
6.03%
 
466,312
   
18,068
4.03%
1999
2000
1,428,690
687,231
92.69%
107,371
8.13%
 
484,500
198,500
69.41%
18,188
3.90%
2000
2001
1,498,279
   
69,589
4.87%
 
498,638
   
14,138
2.92%
2001
2002
1,578,332
   
80,053
5.34%
 
507,219
   
8,581
1.72%
2002
2003
1,641,529
   
63,197
4.00%
 
516,723
   
9,504
1.87%
2003
2004
1,747,025
   
105,496
6.43%
 
534,168
   
17,445
3.38%
2004
2005
1,815,700
   
68,675
3.93%
 
544,806
   
10,638
1.99%
2005
2006
1,925,654
   
109,954
6.06%
 
552,855
   
8,049
1.48%
2006
2007
1,996,542
   
70,888
3.68%
 
559,892
   
7,037
1.27%
2007
2008
1,986,146
   
-10,396
-0.52%
 
562,849
   
2,957
0.53%
2008
2009
2,006,347
   
20,201
1.02%
 
567,641
   
4,792
0.85%
2009
2010
2,036,358
607,668
42.53%
30,011
1.50%
 
583,756
99,256
20.49%
16,115
2.84%
2010
2011
1,966,630
   
-69,728
-3.42%
 
589,317
   
5,561
0.95%
2011

Number of Visitors to Las Vegas (1970-2011):

Number of visitors to Las Vegas in 2011: 38,928,708.
Number of visitors to Las Vegas in 2010: 37,335,436
Number of visitors to Las Vegas in 2000:  35,849,691 
Number of visitors to Las Vegas in 1990:  20,954,420
Number of visitors to Las Vegas in 1980:  11,941,524  

Number of visitors to Las Vegas in 1970:  7,361,783 


LAKE MEAD AT HOOVER DAM, ELEVATION (FEET)

All data are supplied from Bureau of Reclamation Records.  Last updated: 03-January-2013
Year
JAN
FEB
MAR
APR
MAY
JUN
JUL
AUG
SEP
OCT
NOV
DEC
2012
1134.18
1133.06
1129.41
1123.93
1119.38
1115.84
1115.92
1116.56
1115.16
1116.50
1117.24
1120.36
2011
1091.73
1095.78
1096.39
1095.76
1097.90
1102.38
1107.07
1113.45
1116.04
1121.00
1125.82
1132.83
2010
1100.02
1103.21
1100.66
1098.00
1094.30
1089.30
1086.97
1086.91
1083.81
1082.36
1081.94
1086.30
2009
1111.78
1111.43
1107.40
1101.26
1096.92
1095.26
1094.20
1093.73
1093.68
1093.26
1093.52
1096.30
2008
1116.46
1116.93
1115.65
1110.61
1107.05
1104.98
1104.42
1105.13
1105.76
1107.94
1107.33
1110.97
2007
1129.55
1129.35
1125.79
1120.69
1115.89
1113.50
1111.58
1111.84
1111.06
1110.95
1111.22
1114.81
2006
1139.46
1141.20
1139.48
1135.94
1131.14
1128.26
1126.42
1126.54
1125.36
1126.13
1126.63
1128.12
2005
1137.40
1143.25
1147.66
1144.45
1141.89
1140.46
1139.01
1139.61
1138.36
1137.01
1135.27
1137.52
2004
1140.39
1140.11
1138.70
1134.98
1129.70
1126.93
1125.73
1126.67
1125.86
1127.43
1130.13
1130.01
2003
1153.33
1154.42
1153.09
1148.27
1144.68
1143.19
1141.93
1143.27
1142.12
1141.17
1139.48
1139.12
2002
1177.94
1176.50
1172.06
1167.49
1162.39
1160.19
1157.57
1156.42
1155.42
1154.89
1153.30
1152.13
2001
1197.27
1196.62
1194.68
1190.76
1187.32
1183.12
1180.78
1179.97
1177.96
1178.03
1177.22
1177.37
2000
1214.26
1213.79
1211.33
1208.78
1207.67
1204.09
1199.97
1196.66
1196.72
1196.66
1196.45
1196.12
1999
1212.89
1213.30
1211.75
1208.80
1207.37
1206.40
1207.28
1208.74
1211.29
1212.11
1212.58
1213.94
1998
1214.40
1214.05
1214.26
1212.74
1211.59
1211.83
1212.43
1214.30
1214.78
1215.76
1214.79
1212.53
1997
1195.63
1196.51
1199.10
1200.01
1199.96
1202.32
1203.49
1204.52
1205.81
1209.64
1212.80
1214.64
1996
1193.45
1193.81
1193.81
1192.75
1191.26
1190.43
1190.26
1190.02
1190.84
1191.56
1192.71
1194.38
1995
1180.37
1182.58
1182.27
1179.68
1178.33
1179.03
1180.75
1181.70
1184.28
1186.12
1189.65
1190.92
1994
1190.09
1190.97
1188.51
1184.94
1181.64
1179.42
1178.97
1178.24
1178.40
1177.80
1175.67
1176.55
1993
1183.64
1189.88
1193.46
1193.04
1190.27
1188.27
1187.20
1188.41
1189.15
1188.05
1188.45
1188.75
1992
1177.25
1179.42
1180.31
1179.78
1177.31
1175.07
1173.92
1173.59
1174.44
1174.68
1175.45
1176.86
1991
1179.39
1180.06
1179.31
1177.80
1175.92
1174.67
1173.29
1172.92
1173.01
1171.73
1171.82
1173.44
1990
1191.00
1191.75
1189.56
1186.89
1183.93
1182.06
1179.49
1178.82
1180.02
1178.90
1178.54
1177.89
1989
1201.40
1202.49
1200.28
1197.35
1192.59
1190.40
1189.72
1189.40
1190.22
1189.55
1189.02
1189.80
1988
1211.17
1211.70
1210.74
1208.36
1206.23
1203.18
1201.43
1199.57
1199.16
1199.15
1199.46
1199.75
1987
1210.23
1210.58
1208.57
1207.67
1205.99
1206.60
1207.80
1209.56
1209.79
1208.69
1210.05
1211.03
1986
1201.59
1202.72
1202.45
1204.78
1208.16
1210.13
1207.14
1207.52
1208.83
1208.70
1209.77
1210.39
1985
1206.95
1206.68
1206.43
1206.16
1209.83
1214.25
1213.95
1212.79
1213.14
1211.16
1208.76
1205.49
1984
1209.82
1207.67
1206.05
1205.91
1209.74
1212.17
1212.92
1211.40
1210.06
1208.63
1208.29
1207.90
1983
1206.83
1210.25
1211.59
1211.26
1212.33
1220.27
1225.44
1222.17
1218.21
1215.32
1213.38
1212.33
1982
1201.15
1202.39
1201.02
1198.30
1196.93
1196.42
1196.48
1197.39
1198.96
1201.06
1204.76
1208.37
1981
1203.58
1204.31
1202.15
1198.44
1196.22
1193.70
1192.88
1192.78
1192.67
1194.11
1195.42
1198.28
1980
1198.99
1204.13
1202.87
1201.94
1199.93
1202.27
1204.65
1204.58
1204.92
1203.21
1203.68
1202.88
1979
1198.83
1202.61
1201.04
1200.01
1197.55
1195.50
1194.86
1195.71
1195.30
1195.12
1196.64
1197.97
1978
1186.09
1187.62
1188.44
1186.14
1184.58
1184.76
1183.31
1183.74
1185.43
1186.69
1188.73
1193.31
1977
1193.01
1191.98
1189.01
1183.10
1179.83
1176.16
1175.34
1177.27
1180.48
1180.36
1179.29
1180.82
1976
1180.93
1182.90
1181.25
1179.68
1180.39
1180.47
1179.85
1177.84
1179.40
1182.16
1185.94
1187.87
1975
1178.74
1178.38
1177.13
1174.18
1173.66
1174.48
1176.97
1178.16
1180.10
1180.41
1179.64
1179.63
1974
1180.14
1178.08
1174.95
1171.35
1169.68
1169.60
1171.87
1173.30
1173.99
1173.83
1175.67
1176.80
1973
1172.75
1174.73
1178.78
1186.14
1185.93
1186.34
1184.89
1182.28
1180.26
1179.47
1178.70
1176.92
1972
1162.27
1160.94
1156.12
1154.74
1154.35
1154.60
1154.84
1156.28
1158.49
1161.59
1163.82
1168.35
1971
1152.87
1150.40
1148.29
1148.63
1149.06
1149.85
1151.22
1152.85
1153.61
1154.40
1156.84
1160.13
1970
1153.65
1153.32
1151.06
1150.80
1150.87
1150.73
1150.53
1151.33
1152.58
1151.77
1151.75
1152.95
1969
1140.46
1140.67
1139.34
1140.79
1141.26
1141.79
1143.32
1145.31
1146.86
1147.22
1149.71
1152.50
1968
1132.07
1132.54
1132.79
1134.15
1135.18
1136.23
1136.76
1136.89
1136.44
1137.46
1139.05
1139.65
1967
1133.42
1133.31
1131.65
1131.72
1131.49
1130.40
1128.81
1128.44
1130.20
1128.67
1127.71
1129.84
1966
1132.24
1133.05
1132.24
1132.15
1133.07
1132.70
1130.32
1128.21
1127.59
1128.42
1129.72
1132.05
1965
1089.83
1090.63
1088.31
1094.57
1110.08
1125.69
1124.33
1124.32
1124.79
1125.90
1127.93
1129.74
1964
1131.74
1128.40
1123.85
1123.41
1119.32
1112.47
1103.84
1098.58
1093.49
1090.12
1089.02
1088.14
1963
1190.98
1189.67
1185.07
1179.06
1172.43
1167.16
1160.27
1153.88
1149.04
1144.99
1141.50
1136.93
1962
1153.56
1156.51
1154.69
1165.75
1185.56
1198.17
1203.98
1200.87
1197.64
1196.65
1195.05
1193.12
1961
1162.67
1160.75
1156.19
1153.56
1154.45
1161.19
1157.62
1154.05
1153.74
1155.15
1155.22
1154.64
1960
1165.09
1163.78
1164.26
1169.94
1175.09
1183.71
1181.32
1175.25
1170.36
1168.47
1167.46
1165.12
1959
1182.31
1182.03
1176.60
1172.83
1172.59
1179.84
1179.27
1175.65
1171.13
1169.35
1168.85
1167.28
1958
1170.95
1168.56
1163.64
1164.61
1185.52
1205.43
1203.39
1198.97
1195.57
1192.45
1189.59
1185.85
1957
1095.05
1094.32
1092.24
1091.00
1109.31
1150.81
1176.08
1182.34
1182.52
1182.50
1181.61
1177.39
1956
1089.20
1087.06
1083.57
1083.81
1098.00
1116.62
1114.58
1110.66
1105.76
1102.05
1099.14
1097.02
1955
1100.77
1096.14
1092.85
1089.72
1095.90
1105.91
1103.65
1102.78
1098.50
1095.11
1092.63
1090.99
1954
1141.44
1138.22
1134.08
1130.26
1130.76
1129.88
1126.25
1120.82
1115.39
1112.90
1109.74
1105.40
1953
1162.56
1157.12
1152.42
1148.40
1147.33
1165.11
1165.87
1163.38
1157.67
1152.99
1150.06
1145.78
1952
1149.06
1143.00
1133.99
1141.96
1171.53
1198.06
1199.88
1195.74
1190.00
1183.13
1176.39
1169.10
1951
1151.47
1168.02
1144.07
1141.34
1146.16
1163.53
1168.19
1167.00
1163.75
1160.42
1157.25
1153.12
1950
1163.40
1156.70
1151.75
1152.13
1158.57
1173.95
1177.15
1173.36
1168.77
1164.43
1160.19
1156.62
1949
1158.04
1150.99
1147.17
1148.28
1164.51
1189.07
1196.61
1193.17
1186.86
1181.19
1176.93
1170.06
1948
1164.52
1158.80
1154.51
1158.77
1175.95
1192.15
1190.32
1186.95
1180.82
1175.89
1170.91
1164.85
1947
1142.60
1133.10
1135.38
1134.49
1151.93
1169.64
1177.18
1180.13
1178.02
1177.88
1175.24
1170.58
1946
1157.55
1151.65
1147.45
1148.20
1155.15
1163.95
1163.30
1161.25
1157.65
1153.90
1151.65
1148.55
1945
1161.25
1155.75
1149.60
1147.40
1161.30
1174.55
1180.70
1177.95
1177.95
1173.60
1168.95
1163.35
1944
1170.90
1164.20
1158.40
1158.10
1173.20
1194.85
1199.55
1193.90
1187.10
1180.60
1174.55
1168.00
1943
1182.45
1179.60
1177.00
1180.60
1188.75
1199.40
1201.55
1199.65
1195.70
1189.90
1184.50
1178.35
1942
1184.80
1176.75
1171.25
1182.90
1195.50
1213.15
1213.20
1210.40
1205.00
1199.25
1194.05
1188.40
1941
1167.10
1167.55
1170.35
1175.85
1201.25
1215.55
1220.40
1216.50
1209.85
1211.25
1205.60
1195.80
1940
1166.90
1166.00
1164.65
1164.85
1175.35
1182.15
1179.80
1176.10
1174.45
1173.75
1170.80
1168.05
1939
1165.40
1157.40
1158.20
1162.90
1176.20
1183.45
1181.30
1177.35
1178.95
1176.10
1173.05
1169.95
1938
1095.00
1094.85
1100.20
1109.20
1134.40
1165.60
1173.50
1171.95
1173.80
1171.45
1168.70
1168.65
1937
1022.20
1026.20
1031.00
1044.60
1078.70
1096.60
1102.80
1099.60
1097.60
1096.70
1096.00
1095.75
1936
907.90
908.40
906.90
922.20
982.40
1015.50
1020.40
1024.40
1024.60
1022.60
1023.60
1023.50
1935
---
708.70
701.70
752.40
806.60
909.10
928.40
925.90
920.80
914.90
908.30
908.40


U.S. Drought Monitor Map for December 18, 2012, corresponding to the time of my visit to Lake Mead.


U.S. Drought Monitor Map Animation for all of 2012.

_____________________________________________________________________________________

Related Links:
History of Las Vegas
Las Vegas History and Facts
Las Vegas Timeline
Las Vegas Data
Las Vegas History
Cities with Largest Growth
Las Vegas Growth Slows
Las Vegas Demographics
City Data, Las Vegas
Las Vegas Population Data
Las Vegas, Population Listing
Comprehensive Planning Demographics - Clark County Nevada
Las Vegas Stats and Facts
Las Vegas Demographics
Las Vegas Visitor Statistics 1970-2011

All Images © Ken Dewey, Applied Climate Science, School of Natural Resources

Link to all of the Photo Galleries

.

Applied Climate Science 
School of Natural Resources