Lake Mead Elevation at Hoover Dam Continues to Fall
October 31, 2007 Report
 
Ken Dewey, Applied Climate Sciences Group at the UNL School of Natural Resources.

Lake Mead's elevation continues to fall due to (1) continued drought in the southwestern U.S. and,
(2), increased population growth with associated demand for water resources.


Lake Mead's elevation is 15 feet lower than last year at this time!
Lake Mead is 118 feet below maximum elevation!
Lake Mead has fallen to 46% of capacity!


Photo Gallery One (October 2007)
Photo Gallery Two (October 2007)


> The level of Lake Mead at Hoover Dam has been falling since October 1998, when it reached the
    all-time high of 1215.76 feet.

> The current level of Lake Mead at Hoover Dam has dropped 104.66 feet since October 1998.

> The October 2007 level of 1111.1 feet is the lowest October level since 1964 when it was only 1095.12 feet.

> It took 19 years after the 1964 low point for Lake Mead to fill up again.

Lake Mead Max. Elevation: 1,229 feet
Current Elevation (October 25, 2007): 1,111.1 feet
Max. Surface area: 162,700 acres
Current (October 25, 2007) Surface area: 93,900 acres
Current (October 25, 2007) Feet Below Maximum elevation: -118 feet
Current (October 25, 2007) Percent Full: 46%

LINK TO all of the Lake Mead Elevation Data Archive
   ..

NOTE: as of October 25, 2007:
Horseshoe Lake is only at 3% of capacity
Alamo Reservoir is only at 12% of capacity

The following table has additional information on water levels on nearby reservoirs.

October 25, 2007 
Reservoir Levels in the Southwest
(The data in this table are from Arizona Game and Fish)

Alamo Reservoir: 
Max. Elevation (ft): 1,235  Current Elevation (ft): 1,112 
Max. Surface (acres): 13,300 Current Surface (acres): 3,196 
Feet Below Max.: -123 Percent Full: 12% 

Apache Lake: (Horse Mesa) 
Max. Elevation (ft): 1,914  Current Elevation (ft): 1,909 
Max. Surface (acres): 2,656 Current Surface (acres): 2,580 
Feet Below Max.: -5 Percent Full: 95% 

Bartlett: 
Max. Elevation (ft): 1,798  Current Elevation (ft): 1,756 
Max. Surface (acres): 2,815 Current Surface (acres): 1,692 
Feet Below Max.: -42 Percent Full: 48% 

Canyon Lake: (Mormon Flat) 
Max. Elevation (ft): 1,660 Current Elevation (ft): 1,605 
Max. Surface (acres): 947 Current Surface (acres): 517 
Feet Below Max.: -55 Percent Full: 29% 

Lake Havasu: 
Max. Elevation (ft): 450  Current Elevation (ft) : 447 
Max. Surface (acres): 20,400 Current Surface (acres): 19,100 
Feet Below Max.: -3 Percent Full: 91% 
 Lake Havasu, unlike Lake Powell and Lake Mead is not allowed to 
substantially change its storage.  This is the result of it being a feeder lake 
into the Los Angeles aqueduct system

Horseshoe Lake: 
Max. Elevation (ft): 2,026 Current Elevation (ft): 1,953 
Max. Surface (acres): 2,812 Current Surface (acres): 548 
Feet Below Max.: -73 Percent Full: 3% 
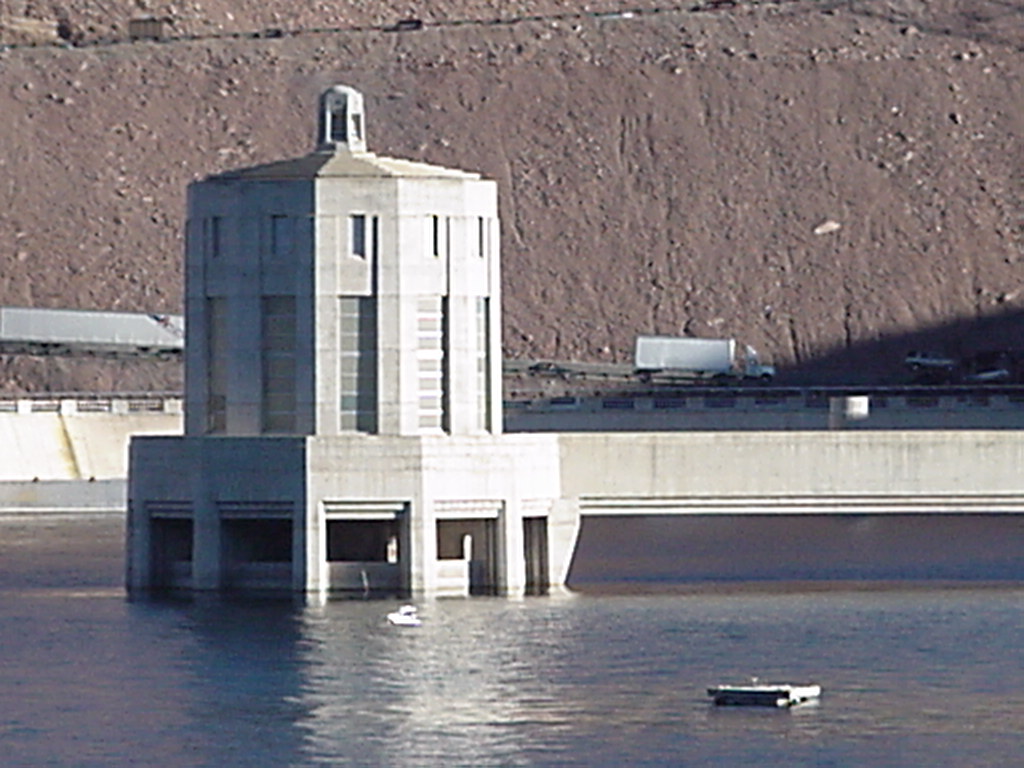
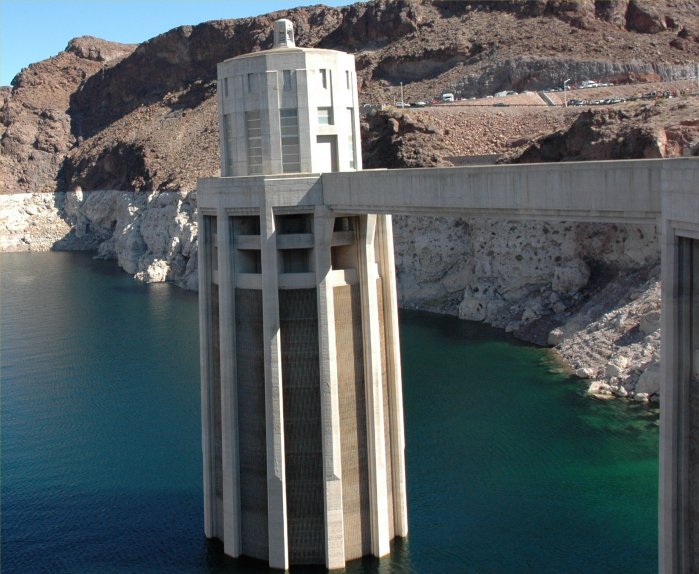
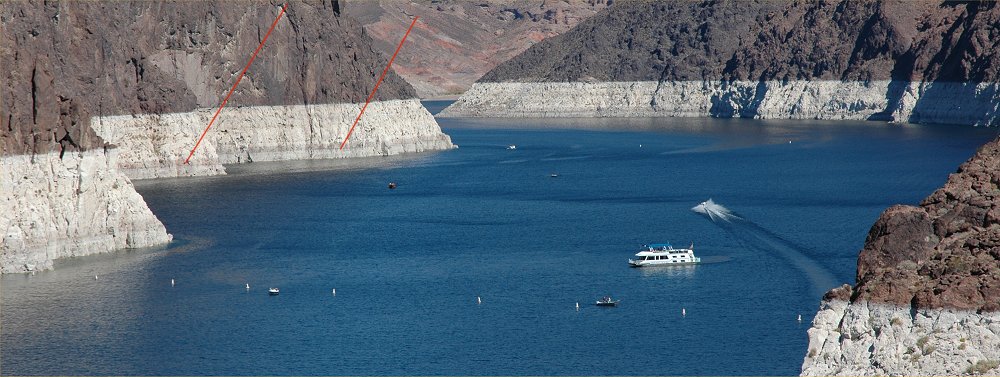
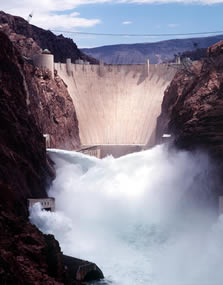
Lake Mead: 
Max. Elevation (ft): 1,229  Current Elevation (ft): 1,111 
Max. Surface (acres): 162,700 Current Surface (acres): 93,900 
Feet Below Max.: -118 Percent Full: 46%* 
* Percent Full calculations does not include the flood control volume adjustment 

Lake Mohave: 
Max. Elevation (ft): 647  Current Elevation (ft): 634 
Max. Surface (acres): 28,800  Current Surface (acres): 25,700 
Feet Below Max.: -13 Percent Full: 81% 

Lake Pleasant: (Waddell Dam) 
Max. Elevation (ft): 1,702  Current Elevation (ft): 1,644 
Max. Surface (acres): 9,957 Current Surface (acres): 6,268 
Feet Below Max.: -58 Percent Full: 46% 

Lake Powell: 
Max. Elevation (ft): 3,700 Current Elevation (ft): 3,601 
Max. Surface (acres): 160,800 Current Surface (acres): 95,900 
Feet Below Max.: -99 Percent Full: 49%

Roosevelt Lake: 
Max. Elevation (ft): 2,151  Current Elevation (ft): 2,099 
Max. Surface (acres): 21,493 Current Surface (acres): 13,455 
Feet Below Max.: -52 Percent Full: 46%

San Carlos: 
Max. Elevation (ft): 2,525  Current Elevation (ft): 2,441 
Max. Surface (acres): 19,985 Current Surface (acres): 5,539 
Feet Below Max.: -84 Percent Full: 12%

 
April 1998:  Elevation 1212.74 feet
Photo: Colorado River Commission of Nevada
October 2007:  Elevation 1111.0 feet
Photo: Ken Dewey, SNR

 
The phenomenal Growth of Las Vegas continues to put pressure on the water resources

1905 -- Town of Las Vegas established by auctioning of land. 
1911 -- The city of Las Vegas is incorporated.
1931 -- Hoover Dam construction begins in Black Canyon.
1940 -- Clark County population 16,414 (Las Vegas:  8,422).
1950 -- Clark County population 48,289 (Las Vegas: 24,624).
1960 -- Clark County population 127,016 (Las Vegas:  64,405).
1970 -- Clark County population 273,288 (Las Vegas: 125,787).
1980 -- Clark County population 463,087 (Las Vegas: 164,674)
1990 -- Clark County population 741,459 (Las Vegas:  258,295)
1995 -- Clark County population for the first time is estimated at more than 1 million residents.
2000 -- Clark County population 1,425,723 (Las Vegas:  483,448)
2001 -- Clark County's population 1,498,274 (Las Vegas:  506,111)
2003 -- Clark County's population 1,641,529 (Las Vegas:  535,395) 
2006 -- Clark County population 1,912,654 (Las Vegas:  591,536)

New residents arriving in Clark County:
1990:  5,128 per month
1995:  5,384 per month
2000:  6,849 per month
2006:  8,080 per month

Number of visitors to Las Vegas in 1970:  6.8 million 
Number of visitors to Las Vegas in 2004:  37.4 million 


October 15, 2007:  Pollution hangs over the Las Vegas skyline


Previous HPRCC/NDMC Lake Mead, Southwest Drought Reports
(with photos)

The year 2006 Drought in the Southwestern U.S.

The year 2003 Drought in the Southwestern U.S.

The Year 2002 Drought in the Southwestern U.S.


 Image © Ken Dewey, HPRCC.  Lake Mead at 51% of capacity (October 31, 2006).
For more information about this photo and what is indicated by the
red lines put on the image, see the photo galleries.

The white "bathtub ring" is the result of exposing rocks that were at one time
under the water and collecting mineral deposits.  A clear glass, for example, dipped in
water and then allowed to dry will have mineral deposit "spots" on the glass.

2006 Photo Gallery 1
2006 Photo Gallery 2
2006 Photo Gallery 3
2006 Photo Gallery 4
Lake Mead, and Vicinity, Water Issues -  News Reports and Data

Hidden Oasis: Water Conservation and Efficiency in Las Vegas

Stakes High for Las Vegas Water Czar

Satellite Sees a Smaller Lake Mead

Drought Lowers Lake Mead

Lake Mead in Drought

Lake Mead, National Park Service:  Low Water News

Lake Mead:  Why is the Water Going Down?

NASA:  Lake Mead Water Level Drops

Lake Mead Water Level Taking a Toll on Businesses

The Colorado River System is in the Worst Drought on Record

Small Earthquakes at Lake Mead Blamed on Drought and Low Level of the Lake

Drought Conditions in the West

Water Data.Com

Lake Powell Water Levels

History of Glen Canyon and Lake Powell

Lakes Low Water Levels Exposes Prized Canyons

Hoover Dam Bypass Bridge:  Construction Resuming Slowly Following Collapse

Quenching Thirst

Single Firm to Design, Build Water Intake

Drought Shrinking Jewels of the Desert

Moving Into Deeper Water

Interior Chief Cites Progress on Water Deal

A Crisis Brews on the Colorado

Drought Stricken West:  Daily Routines Tapped to Save Water

Colorado River:  Drought and Deadlines

 
Hoover Dam Information
A view of the Hoover Dam when the water level is high enough that water is going into the spillways on the other side and disgorging on this side.

Photo courtesy of the Bureau of Reclamation.

Bureau of Reclamation

Hoover Dam Tours

Sunset Cities:  History of Hoover Dam

The Hoover Dam:   Lonely Lands Made Fruitful

Hoover Dam U.S. 93 Bypass Project

Hoover Dam Museum

Desert U.S.A. Hoover Dam Information


October 30, 2007 Drought Monitor Map

Last Year

Click HERE  or on the above map to see the current U.S. Drought Monitor Map


The National Drought Mitigation Center
            ....
UNL
University of Nebraska-Lincoln
Applied Climate Sciences, School of Natural Resources

Return to:   The Photo Gallery Index Page