| The Advanced Very
High Resolution Radiometer (AVHRR) is a sensor that is mounted on the NOAA
series of meteorological satellites. There are currently two such
satellites in polar orbit which takes them around the Earth approximately
every 102 minutes, NOAA-12 and NOAA-14. This orbital period allows
for 14.1 orbits per day with the satellites orbiting on opposite sides
of the Earth.
There are several
data sets that are available from the NOAA AVHRR sensor:
a.HRPT
- High Resolution Direct Readout AVHRR
b.LAC
- Recorded HRPT AVHRR
c.GAC
- Reduced Resolution Recorded AVHRR
TOVS - TIROS Operational
Vertical Sounder, which includes:
a.MSU
- Microwave Sounding Unit
b.SSU
- Stratospheric Sounding Unit
c.HIRS/2
- High Resolution Infrared Radiation Sounder/2
For more information
about each of these, the reader is referred to the NOAA website located
at:
http://perigee.ncdc.noaa.gov/docs/intro.htm
The Center for Advanced
Land Management Information Technologies (CALMIT), located here at UNL,
receives the HRPT product and maintains a month-long image archive it which
is available for download. The CALMIT website is located at
http://www.calmit.unl.edu/calmit.html; just follow the directions
on how to reach the archives.
The five bands that
are available on the website are listed below:
| Channel |
1
|
2
|
3
|
4
|
5
|
Wavelength
(microns) |
.58 - .68
|
.73 - 1.10
|
3.55 - 3.93
|
10.3 - 11.3
|
11.5 - 12.5
|
| Description |
Reflected Visible |
Reflected Near-infrared |
Emitted Thermal |
Emitted Thermal |
Emitted Thermal |
Although designed
for meteorological purposes, the AVHRR sensor has been used to assess landcover
and landuse all over the Earth. A representation of this can be seen
below:
Click
on the image to see a larger version
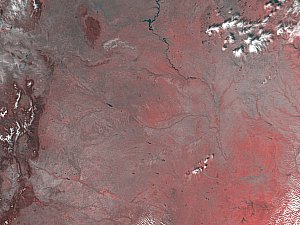
This Image is from
the NOAA-14 Satellite and was acquired on October 17, 1997. The colors
that you see are the result of two of the bands being represented by the
colors of red, green and blue. In this image Band 2 (the reflected
near-infrared) is being represented by red, while Band 1 is being represented
by the colors of green and blue. In this representation, the presence
of vegetation is represented by tones of red. The darker-toned red
feature near the top of the image is the South Dakota Black Hills.
The similar feature toward the left of the image is the Colorado Front
Range. The state of Nebraska is located in the center of the image.
The other reddish-toned features are probably either agricultural crops,
or natural vegetation.
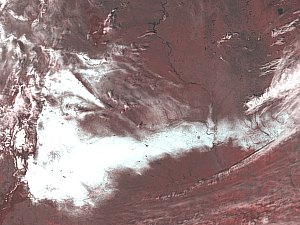
This is a particularly
useful representation to observe the extent of the snowcover that resulted
from the October snowstorm as you can see in the figure below.
Click
on the image to see a larger version
As you can see the
snow coverage is a particularly narrow band, extending from Colorado in
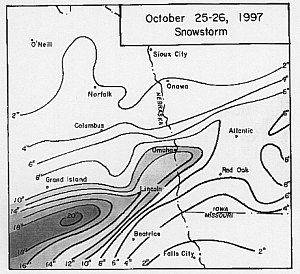
an east, northeast direction. The depth of the snow varied considerably
as the figure below illustrates.
Click
on the image to see a larger version
Although the preceeding
two figures do not cover exactly the same area, they combination of the
two provide a good indication of the extent and depth of the snow cover
that can be observed form satellite imagery.
Although the bands
of information shown in the AVHRR images show a lot of detail, such a representation
cannot be obtained from the GOES satellites.
Return
to the October 1997 Snowstorm Report
|